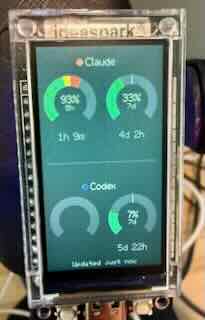
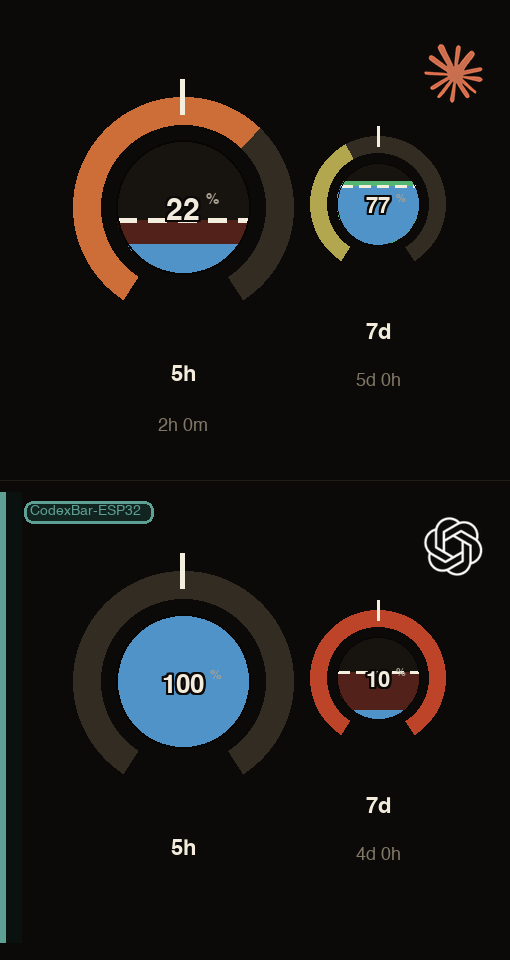
 In the simulated image, Codex is waiting on the `CodexBar-ESP32` project: the blue left rail and project chip are the attention indicator.
Each gauge has three related readouts:
**The number in the center** shows the percentage of that window's allowance you have *remaining*. 77% means you have 77% of your quota left.
**The arc color is different — it shows pace, not consumption.**
Think of it like the RPM gauge on a race car. The tachometer doesn't tell you how much fuel you've used; it tells you whether your *current engine speed* is sustainable. Redline the engine and you'll blow it up before the race is over. Back off and you'll finish fine. The arc gauge works the same way:
> *"If I keep using Claude at exactly the rate I have been so far in this window, will I hit the limit before the window resets?"*
To answer that, the gauge computes what your usage *should* be at this point in the window if you were consuming it at a perfectly even rate, then compares that to what you've actually used:
- **Expected usage** = (time elapsed ÷ total window duration) × 100%
- **Pace ratio** = actual usage % ÷ expected usage %
A pace ratio of 1.0 — the white tick mark at 12 o'clock — means you're consuming at exactly the sustainable rate. Below it is fine. Above it is the redline.
### Reading the arc
The arc fills from lower-left clockwise up toward 12 o'clock:
| Arc | Meaning |
|---|---|
| Green | Comfortably under pace — current burn rate is sustainable |
| Gold / rust | Approaching or crossing the sustainable limit |
| White tick at 12 o'clock | Exactly on pace — this is your "redline" |
| Rust past 12 o'clock | Over pace — at this rate you will hit the wall before the window resets |
The arc spans from lower-left to lower-right with a 66-degree gap at the bottom. Pace ratio `0` maps to the lower-left start, `1.0` maps to the white 12 o'clock tick, and `2.0` maps to the lower-right end.
### Reading the fuel circle
The inner circle is a fuel tank for remaining capacity:
| Fuel circle | Meaning |
|---|---|
| Blue | Actual capacity remaining |
| Green cap | Extra capacity above the expected line — you are ahead of pace |
| Red ghost | Missing fuel between actual remaining and where you should be |
| Dashed line | Expected remaining capacity for this point in the window |
So if the fuel level is below the dashed line, the display keeps the actual fuel blue and adds a muted red ghost for the amount you have overspent relative to a perfectly even burn rate.
### Why this is useful
The percentage alone is misleading. Being at 80% with 10% of the window remaining is a crisis. Being at 80% with 90% of the window remaining is fine — you've just been a light user so far. The pace arc makes the distinction instantly visible without any mental math.
Conversely, being at 5% sounds safe, but if you burned that 5% in the first five minutes of a 5-hour window, you're on track to hit 100% within the hour. The arc will be deep in the red even though the number looks small.
### Window types
| Label | Size | Position |
|---|---|---|
| `5h` | Large (left) | 5-hour rolling window |
| `7d` | Small (right) | 7-day rolling window |
| `Opus` | Small (right) | 7-day Opus-model window (replaces `7d` when available) |
The 5h gauge is drawn larger to give prominence to the window you're most likely to run into during an active session. The 7d/Opus gauge is still large enough to read at a glance, but slightly smaller to avoid crowding the section edge.
The pace calculation is identical for every window — only the window duration changes.
### Early-window dimming
During the first 5% of a window (e.g., the first 15 minutes of a 5-hour window) there is too little elapsed time for the pace ratio to be meaningful — any non-zero usage looks like a catastrophic burn rate. During this period the arc colors render at ~25% opacity so a brief spike right after a reset doesn't look alarming.
### Idle dimming
The display also dims when usage is unchanged. After each successful poll, the ESP32 compares the latest Claude and Codex usage percentages with the previous reading. If none of the LLM usage values have changed, the backlight steps down one level; after five unchanged polls it has dimmed across all five steps. Any usage change immediately restores the configured brightness.
### Attention state
CodexBar can also show when a local Claude or Codex coding session needs you. Agent hooks post lifecycle events to the Mac companion's local `/attention` endpoint. The companion aggregates active sessions by provider/project, and the ESP32 polls local `/status` every few seconds.
When a session enters `needs_user`, the display wakes from dimmed brightness, pulses the provider rail, and shows either the project name or `N waiting` in the top-left chip. The companion can also send an ntfy notification to the default topic `codingAgentWaitingOnYou`, which is useful if you step away from the desk.
Local-only model runners such as LM Studio are supported as notification-only attention sources. They can post `TaskComplete` or `Stop` to `/attention` with provider `LM Studio`; the companion sends the low-priority ntfy completion notification but does not add LM Studio to `/status`, `/usage`, usage windows, or the ESP32 UI.
Usage reset notifications use a separate ntfy topic, `codexbarUsageResets`, so you can subscribe to reset-only alerts without mixing them with agent attention notifications. Set `CODEXBAR_USAGE_RESET_NTFY_TOPIC` if you want a private/custom reset topic.
`/status` is local-only. It reads in-memory companion state and does not call Anthropic/OpenAI/Codex usage endpoints, so fast attention polling does not increase provider API traffic.
---
## Quick Start
### 1. Install Arduino Libraries
In Arduino IDE → Tools → Manage Libraries:
- **TFT_eSPI** by Bodmer
- **ArduinoJson** by Benoit Blanchon (v7+)
### 2. Configure TFT_eSPI for this board
```bash
cd CodexBar-ESP32/
bash setup.sh
```
This copies `codexbar_esp32/User_Setup.h` into your TFT_eSPI library folder with the correct pin config for the IdeaSpark board.
### 3. Configure WiFi + proxy IP
Copy and edit the config:
```bash
cp codexbar_esp32/config.h.example codexbar_esp32/config.h
```
```cpp
#define WIFI_SSID "YourSSID" // must be 2.4 GHz — ESP32 does not support 5 GHz
#define WIFI_PASS "YourPassword"
#define PROXY_HOST "your-mac.local" // prefer the Mac's stable mDNS hostname over a raw IP —
// it survives DHCP reassignment; find it with `hostname`.
// A raw IP (printed by server.py on start) also works.
#define TFT_BRIGHTNESS 64 // backlight 0–255; 64 is comfortable for desk use
#define STATUS_SECS 5 // local-only attention polling interval
```
### 4. Start the companion proxy
```bash
python3 companion/server.py
```
The proxy reads your Claude CLI credentials from the macOS Keychain and optionally Codex credentials from `~/.codex/auth.json`, then serves usage data on port 7842. If another instance is already listening, manual startup prints the PID and exits; use `CODEXBAR_REPLACE_EXISTING=1 python3 companion/server.py` only when you intentionally want to replace it.
### 5. Optional: enable attention hooks
The companion accepts hook events at:
```text
POST http://127.0.0.1:7842/attention
```
See [docs/attention-hook-setup.md](docs/attention-hook-setup.md) for Claude and Codex hook examples. The shared hook forwarder is [companion/attention_hook.py](companion/attention_hook.py). For LM Studio completion-only notifications, call [companion/lmstudio_notify.py](companion/lmstudio_notify.py) at the end of your local model wrapper script.
### 6. Flash the ESP32
- Open `codexbar_esp32/codexbar_esp32.ino` in Arduino IDE
- Board: **ESP32 Dev Module**
- Upload Speed: **921600**
- Flash Size: **16MB (128Mb)**
- Port: select the CH340 USB serial port (`/dev/cu.wchusbserial*` on macOS)
- Click Upload
---
## Architecture
```
Mac (companion/server.py) ESP32
┌────────────────────────┐ HTTP ┌────────────────────────┐
│ Reads Keychain token │ ◄────────► │ Polls /usage every 5min│
│ Calls api.anthropic.com│ │ Renders pace gauges │
│ Optionally reads Codex │ │ ST7789 170×320 display │
│ Receives hook events │ │ Polls /status locally │
│ Serves /usage + /status│ │ Shows attention state │
└────────────────────────┘
```
The ESP32 cannot access the macOS Keychain directly, so the companion proxy bridges OAuth authentication to a simple unauthenticated local HTTP endpoint. Attention events are local machine state; hooks post them to the companion without involving provider APIs.
---
## Development
The companion server uses the Python standard library. The display simulator uses Pillow, installed via dev requirements:
```bash
python3 -m venv .venv
.venv/bin/python -m pip install -r requirements-dev.txt
.venv/bin/python -m unittest discover -s tests
.venv/bin/python simulate_display.py --attention --out /tmp/codexbar_attention_sim.png
.venv/bin/python simulate_display.py --startup --out /tmp/codexbar_startup_sim.png
# The simulator renders N=1 (landscape) or N=2/3 (portrait stacked) automatically
# based on how many providers are present in the data. Pass --attention to show
# the waiting-on-you indicator for the first provider.
```
Firmware compile/upload is currently done through Arduino IDE.
Hardware serial logs can be captured from the terminal:
```bash
.venv/bin/python tools/serial_capture.py --list
.venv/bin/python tools/serial_capture.py --port /dev/cu.wchusbserial110 --seconds 90 --expect-usage
```
---
## Files
```
CodexBar-ESP32/
├── README.md This file
├── requirements-dev.txt Python dev/test dependencies
├── setup.sh Copies User_Setup.h to TFT_eSPI library
├── simulate_display.py Desktop renderer for display previews
├── assets/
│ └── icons/ Provider icons (claude.png, codex.png, …)
├── docs/
│ ├── attention-hook-setup.md Claude/Codex hook setup examples
│ ├── attention-state-punchlist.md Implementation checklist/backlog
│ ├── attention-state-spec.md Feature spec
│ ├── display-design.md Detailed graph-reading and layout notes
│ └── wifi-esp32-notes.md WiFi quirks, status codes, and reconnect design notes
├── codexbar_esp32/
│ ├── codexbar_esp32.ino Main Arduino sketch
│ ├── config.h WiFi, proxy IP, display constants (gitignored)
│ ├── config.h.example Safe template to copy and fill in
│ └── User_Setup.h TFT_eSPI pin config (copy to library folder)
├── companion/
│ ├── attention_hook.py Shared Claude/Codex hook forwarder
│ └── server.py Mac proxy — serves /usage, /status, /attention
└── tests/ Companion and hook tests
```
---
## Troubleshooting
**Display stays black:** Check backlight pin (GPIO32). Verify `User_Setup.h` was copied correctly via `setup.sh`.
**"WiFi Failed" / "WiFi not connected":** The ESP32 is not connected to your network. Check SSID/password in `config.h`, confirm the SSID is 2.4 GHz, check that the router is up, and press the ESP32 reset button to retry immediately.
**"Starting up":** Normal immediately after upload/reset. The ESP32 gives WiFi and the companion server a startup grace window before showing no-data diagnostics.
**No data / red dot:** Start `companion/server.py` on your Mac. Verify `PROXY_HOST` matches the IP printed by the server on startup.
**Stale data:** The proxy caches responses for 60 seconds. If the Anthropic API is unreachable, the last good payload is shown until a fresh fetch succeeds.
**Codex section missing:** Normal if you have not logged into the Codex CLI. The proxy silently skips Codex if `~/.codex/auth.json` is absent.
**Attention state never appears:** Start the companion, manually post a test event with the example in [companion/README.md](companion/README.md), then check `curl http://127.0.0.1:7842/status`. If that works, inspect/trust the Claude or Codex hook config.
**I only see a gray/static indicator:** Gray means a `done`/review state, not active waiting. A real `needs_user` state uses the provider color, shows `WAIT ...`, and pulses.
**ESP32 shows "Server not found" / "Server not reachable":** WiFi is connected, but the ESP32 cannot reach the Mac companion at `PROXY_HOST:7842`. This can be normal if the Mac is asleep. On the Mac, run `curl http://127.0.0.1:7842/health`. If it cannot connect, restart `python3 companion/server.py` or install the launchd auto-start in [companion/README.md](companion/README.md). Press the ESP32 reset button after the Mac wakes if you want an immediate retry.
**ESP32 shows "Usage unavailable":** The companion is reachable, but it could not return usable quota data. Check the companion logs and make sure Claude/Codex credentials are still valid.
### Serial Monitor WiFi Codes
Open Arduino IDE Serial Monitor at `115200` baud to see connection details. Common `WiFi.status()` values:
| Code | Meaning | What to try |
|---:|---|---|
| `0` | Idle / changing state | Wait a few seconds; if it repeats, press ESP32 reset |
| `1` | SSID not available | Confirm `WIFI_SSID`, router is on, and SSID is 2.4 GHz |
| `3` | Connected | WiFi is fine; if data is missing, check the companion server |
| `4` | Connection failed | Recheck password/auth settings in `config.h` |
| `5` | Connection lost | Router or signal issue; move closer or restart router |
| `6` | Disconnected | Check SSID/password/router, then press ESP32 reset |
| `254` | Driver/radio not ready | Usually transient after reset; firmware retries automatically |
| `255` | No shield / driver not ready | Usually transient after reset; firmware waits and retries |
If the serial log shows HTTP `Error -1` while WiFi status is connected, that usually means the Mac companion is not reachable at `PROXY_HOST:7842`, not that WiFi is bad. Current firmware prints transport diagnostics with WiFi status, IP, gateway, and RSSI after negative HTTP errors. It also logs a raw `[NET] TCP probe ...` before `/usage` and after failed `/health` probes. If TCP fails, the issue is below HTTP: check Mac IP, macOS Firewall, router/client isolation, or whether the companion process is listening. If TCP succeeds but `/health` or `/usage` fails, the companion process is reachable and the issue is likely server-side.
After repeated TCP probe failures while WiFi still reports connected, the firmware refreshes the ESP32 station state. This is meant to recover from the ESP32/router path getting wedged without treating a single companion outage as a WiFi failure.
On boot, the firmware prints `[CodexBar] Reset reason: ...`. `brownout`, `task_wdt`, or `panic` after repeated WiFi failures points to a power/firmware stability issue rather than the companion server.
**Too many ntfy notifications:** Notifications are deduped per session/state, but hook restarts can create new sessions. Disable attention notifications with `CODEXBAR_NTFY_TOPIC= python3 companion/server.py`, or change the topic with `CODEXBAR_NTFY_TOPIC=myTopic`. Disable reset notifications with `CODEXBAR_USAGE_RESET_NTFY_TOPIC= python3 companion/server.py`, or change the reset-only topic with `CODEXBAR_USAGE_RESET_NTFY_TOPIC=myResetTopic`.
In the simulated image, Codex is waiting on the `CodexBar-ESP32` project: the blue left rail and project chip are the attention indicator.
Each gauge has three related readouts:
**The number in the center** shows the percentage of that window's allowance you have *remaining*. 77% means you have 77% of your quota left.
**The arc color is different — it shows pace, not consumption.**
Think of it like the RPM gauge on a race car. The tachometer doesn't tell you how much fuel you've used; it tells you whether your *current engine speed* is sustainable. Redline the engine and you'll blow it up before the race is over. Back off and you'll finish fine. The arc gauge works the same way:
> *"If I keep using Claude at exactly the rate I have been so far in this window, will I hit the limit before the window resets?"*
To answer that, the gauge computes what your usage *should* be at this point in the window if you were consuming it at a perfectly even rate, then compares that to what you've actually used:
- **Expected usage** = (time elapsed ÷ total window duration) × 100%
- **Pace ratio** = actual usage % ÷ expected usage %
A pace ratio of 1.0 — the white tick mark at 12 o'clock — means you're consuming at exactly the sustainable rate. Below it is fine. Above it is the redline.
### Reading the arc
The arc fills from lower-left clockwise up toward 12 o'clock:
| Arc | Meaning |
|---|---|
| Green | Comfortably under pace — current burn rate is sustainable |
| Gold / rust | Approaching or crossing the sustainable limit |
| White tick at 12 o'clock | Exactly on pace — this is your "redline" |
| Rust past 12 o'clock | Over pace — at this rate you will hit the wall before the window resets |
The arc spans from lower-left to lower-right with a 66-degree gap at the bottom. Pace ratio `0` maps to the lower-left start, `1.0` maps to the white 12 o'clock tick, and `2.0` maps to the lower-right end.
### Reading the fuel circle
The inner circle is a fuel tank for remaining capacity:
| Fuel circle | Meaning |
|---|---|
| Blue | Actual capacity remaining |
| Green cap | Extra capacity above the expected line — you are ahead of pace |
| Red ghost | Missing fuel between actual remaining and where you should be |
| Dashed line | Expected remaining capacity for this point in the window |
So if the fuel level is below the dashed line, the display keeps the actual fuel blue and adds a muted red ghost for the amount you have overspent relative to a perfectly even burn rate.
### Why this is useful
The percentage alone is misleading. Being at 80% with 10% of the window remaining is a crisis. Being at 80% with 90% of the window remaining is fine — you've just been a light user so far. The pace arc makes the distinction instantly visible without any mental math.
Conversely, being at 5% sounds safe, but if you burned that 5% in the first five minutes of a 5-hour window, you're on track to hit 100% within the hour. The arc will be deep in the red even though the number looks small.
### Window types
| Label | Size | Position |
|---|---|---|
| `5h` | Large (left) | 5-hour rolling window |
| `7d` | Small (right) | 7-day rolling window |
| `Opus` | Small (right) | 7-day Opus-model window (replaces `7d` when available) |
The 5h gauge is drawn larger to give prominence to the window you're most likely to run into during an active session. The 7d/Opus gauge is still large enough to read at a glance, but slightly smaller to avoid crowding the section edge.
The pace calculation is identical for every window — only the window duration changes.
### Early-window dimming
During the first 5% of a window (e.g., the first 15 minutes of a 5-hour window) there is too little elapsed time for the pace ratio to be meaningful — any non-zero usage looks like a catastrophic burn rate. During this period the arc colors render at ~25% opacity so a brief spike right after a reset doesn't look alarming.
### Idle dimming
The display also dims when usage is unchanged. After each successful poll, the ESP32 compares the latest Claude and Codex usage percentages with the previous reading. If none of the LLM usage values have changed, the backlight steps down one level; after five unchanged polls it has dimmed across all five steps. Any usage change immediately restores the configured brightness.
### Attention state
CodexBar can also show when a local Claude or Codex coding session needs you. Agent hooks post lifecycle events to the Mac companion's local `/attention` endpoint. The companion aggregates active sessions by provider/project, and the ESP32 polls local `/status` every few seconds.
When a session enters `needs_user`, the display wakes from dimmed brightness, pulses the provider rail, and shows either the project name or `N waiting` in the top-left chip. The companion can also send an ntfy notification to the default topic `codingAgentWaitingOnYou`, which is useful if you step away from the desk.
Local-only model runners such as LM Studio are supported as notification-only attention sources. They can post `TaskComplete` or `Stop` to `/attention` with provider `LM Studio`; the companion sends the low-priority ntfy completion notification but does not add LM Studio to `/status`, `/usage`, usage windows, or the ESP32 UI.
Usage reset notifications use a separate ntfy topic, `codexbarUsageResets`, so you can subscribe to reset-only alerts without mixing them with agent attention notifications. Set `CODEXBAR_USAGE_RESET_NTFY_TOPIC` if you want a private/custom reset topic.
`/status` is local-only. It reads in-memory companion state and does not call Anthropic/OpenAI/Codex usage endpoints, so fast attention polling does not increase provider API traffic.
---
## Quick Start
### 1. Install Arduino Libraries
In Arduino IDE → Tools → Manage Libraries:
- **TFT_eSPI** by Bodmer
- **ArduinoJson** by Benoit Blanchon (v7+)
### 2. Configure TFT_eSPI for this board
```bash
cd CodexBar-ESP32/
bash setup.sh
```
This copies `codexbar_esp32/User_Setup.h` into your TFT_eSPI library folder with the correct pin config for the IdeaSpark board.
### 3. Configure WiFi + proxy IP
Copy and edit the config:
```bash
cp codexbar_esp32/config.h.example codexbar_esp32/config.h
```
```cpp
#define WIFI_SSID "YourSSID" // must be 2.4 GHz — ESP32 does not support 5 GHz
#define WIFI_PASS "YourPassword"
#define PROXY_HOST "your-mac.local" // prefer the Mac's stable mDNS hostname over a raw IP —
// it survives DHCP reassignment; find it with `hostname`.
// A raw IP (printed by server.py on start) also works.
#define TFT_BRIGHTNESS 64 // backlight 0–255; 64 is comfortable for desk use
#define STATUS_SECS 5 // local-only attention polling interval
```
### 4. Start the companion proxy
```bash
python3 companion/server.py
```
The proxy reads your Claude CLI credentials from the macOS Keychain and optionally Codex credentials from `~/.codex/auth.json`, then serves usage data on port 7842. If another instance is already listening, manual startup prints the PID and exits; use `CODEXBAR_REPLACE_EXISTING=1 python3 companion/server.py` only when you intentionally want to replace it.
### 5. Optional: enable attention hooks
The companion accepts hook events at:
```text
POST http://127.0.0.1:7842/attention
```
See [docs/attention-hook-setup.md](docs/attention-hook-setup.md) for Claude and Codex hook examples. The shared hook forwarder is [companion/attention_hook.py](companion/attention_hook.py). For LM Studio completion-only notifications, call [companion/lmstudio_notify.py](companion/lmstudio_notify.py) at the end of your local model wrapper script.
### 6. Flash the ESP32
- Open `codexbar_esp32/codexbar_esp32.ino` in Arduino IDE
- Board: **ESP32 Dev Module**
- Upload Speed: **921600**
- Flash Size: **16MB (128Mb)**
- Port: select the CH340 USB serial port (`/dev/cu.wchusbserial*` on macOS)
- Click Upload
---
## Architecture
```
Mac (companion/server.py) ESP32
┌────────────────────────┐ HTTP ┌────────────────────────┐
│ Reads Keychain token │ ◄────────► │ Polls /usage every 5min│
│ Calls api.anthropic.com│ │ Renders pace gauges │
│ Optionally reads Codex │ │ ST7789 170×320 display │
│ Receives hook events │ │ Polls /status locally │
│ Serves /usage + /status│ │ Shows attention state │
└────────────────────────┘
```
The ESP32 cannot access the macOS Keychain directly, so the companion proxy bridges OAuth authentication to a simple unauthenticated local HTTP endpoint. Attention events are local machine state; hooks post them to the companion without involving provider APIs.
---
## Development
The companion server uses the Python standard library. The display simulator uses Pillow, installed via dev requirements:
```bash
python3 -m venv .venv
.venv/bin/python -m pip install -r requirements-dev.txt
.venv/bin/python -m unittest discover -s tests
.venv/bin/python simulate_display.py --attention --out /tmp/codexbar_attention_sim.png
.venv/bin/python simulate_display.py --startup --out /tmp/codexbar_startup_sim.png
# The simulator renders N=1 (landscape) or N=2/3 (portrait stacked) automatically
# based on how many providers are present in the data. Pass --attention to show
# the waiting-on-you indicator for the first provider.
```
Firmware compile/upload is currently done through Arduino IDE.
Hardware serial logs can be captured from the terminal:
```bash
.venv/bin/python tools/serial_capture.py --list
.venv/bin/python tools/serial_capture.py --port /dev/cu.wchusbserial110 --seconds 90 --expect-usage
```
---
## Files
```
CodexBar-ESP32/
├── README.md This file
├── requirements-dev.txt Python dev/test dependencies
├── setup.sh Copies User_Setup.h to TFT_eSPI library
├── simulate_display.py Desktop renderer for display previews
├── assets/
│ └── icons/ Provider icons (claude.png, codex.png, …)
├── docs/
│ ├── attention-hook-setup.md Claude/Codex hook setup examples
│ ├── attention-state-punchlist.md Implementation checklist/backlog
│ ├── attention-state-spec.md Feature spec
│ ├── display-design.md Detailed graph-reading and layout notes
│ └── wifi-esp32-notes.md WiFi quirks, status codes, and reconnect design notes
├── codexbar_esp32/
│ ├── codexbar_esp32.ino Main Arduino sketch
│ ├── config.h WiFi, proxy IP, display constants (gitignored)
│ ├── config.h.example Safe template to copy and fill in
│ └── User_Setup.h TFT_eSPI pin config (copy to library folder)
├── companion/
│ ├── attention_hook.py Shared Claude/Codex hook forwarder
│ └── server.py Mac proxy — serves /usage, /status, /attention
└── tests/ Companion and hook tests
```
---
## Troubleshooting
**Display stays black:** Check backlight pin (GPIO32). Verify `User_Setup.h` was copied correctly via `setup.sh`.
**"WiFi Failed" / "WiFi not connected":** The ESP32 is not connected to your network. Check SSID/password in `config.h`, confirm the SSID is 2.4 GHz, check that the router is up, and press the ESP32 reset button to retry immediately.
**"Starting up":** Normal immediately after upload/reset. The ESP32 gives WiFi and the companion server a startup grace window before showing no-data diagnostics.
**No data / red dot:** Start `companion/server.py` on your Mac. Verify `PROXY_HOST` matches the IP printed by the server on startup.
**Stale data:** The proxy caches responses for 60 seconds. If the Anthropic API is unreachable, the last good payload is shown until a fresh fetch succeeds.
**Codex section missing:** Normal if you have not logged into the Codex CLI. The proxy silently skips Codex if `~/.codex/auth.json` is absent.
**Attention state never appears:** Start the companion, manually post a test event with the example in [companion/README.md](companion/README.md), then check `curl http://127.0.0.1:7842/status`. If that works, inspect/trust the Claude or Codex hook config.
**I only see a gray/static indicator:** Gray means a `done`/review state, not active waiting. A real `needs_user` state uses the provider color, shows `WAIT ...`, and pulses.
**ESP32 shows "Server not found" / "Server not reachable":** WiFi is connected, but the ESP32 cannot reach the Mac companion at `PROXY_HOST:7842`. This can be normal if the Mac is asleep. On the Mac, run `curl http://127.0.0.1:7842/health`. If it cannot connect, restart `python3 companion/server.py` or install the launchd auto-start in [companion/README.md](companion/README.md). Press the ESP32 reset button after the Mac wakes if you want an immediate retry.
**ESP32 shows "Usage unavailable":** The companion is reachable, but it could not return usable quota data. Check the companion logs and make sure Claude/Codex credentials are still valid.
### Serial Monitor WiFi Codes
Open Arduino IDE Serial Monitor at `115200` baud to see connection details. Common `WiFi.status()` values:
| Code | Meaning | What to try |
|---:|---|---|
| `0` | Idle / changing state | Wait a few seconds; if it repeats, press ESP32 reset |
| `1` | SSID not available | Confirm `WIFI_SSID`, router is on, and SSID is 2.4 GHz |
| `3` | Connected | WiFi is fine; if data is missing, check the companion server |
| `4` | Connection failed | Recheck password/auth settings in `config.h` |
| `5` | Connection lost | Router or signal issue; move closer or restart router |
| `6` | Disconnected | Check SSID/password/router, then press ESP32 reset |
| `254` | Driver/radio not ready | Usually transient after reset; firmware retries automatically |
| `255` | No shield / driver not ready | Usually transient after reset; firmware waits and retries |
If the serial log shows HTTP `Error -1` while WiFi status is connected, that usually means the Mac companion is not reachable at `PROXY_HOST:7842`, not that WiFi is bad. Current firmware prints transport diagnostics with WiFi status, IP, gateway, and RSSI after negative HTTP errors. It also logs a raw `[NET] TCP probe ...` before `/usage` and after failed `/health` probes. If TCP fails, the issue is below HTTP: check Mac IP, macOS Firewall, router/client isolation, or whether the companion process is listening. If TCP succeeds but `/health` or `/usage` fails, the companion process is reachable and the issue is likely server-side.
After repeated TCP probe failures while WiFi still reports connected, the firmware refreshes the ESP32 station state. This is meant to recover from the ESP32/router path getting wedged without treating a single companion outage as a WiFi failure.
On boot, the firmware prints `[CodexBar] Reset reason: ...`. `brownout`, `task_wdt`, or `panic` after repeated WiFi failures points to a power/firmware stability issue rather than the companion server.
**Too many ntfy notifications:** Notifications are deduped per session/state, but hook restarts can create new sessions. Disable attention notifications with `CODEXBAR_NTFY_TOPIC= python3 companion/server.py`, or change the topic with `CODEXBAR_NTFY_TOPIC=myTopic`. Disable reset notifications with `CODEXBAR_USAGE_RESET_NTFY_TOPIC= python3 companion/server.py`, or change the reset-only topic with `CODEXBAR_USAGE_RESET_NTFY_TOPIC=myResetTopic`.